
Installing the ngspice Simulator
For a quick introduction to ngspice, you can visit their website, or you can proceed to the download page. You can access the user manual here.
Example: MOS Characteristic Curves
Once you have ngspice installed, you can run it interactively, or in batch mode. Let’s plot the transistor characteristics in the interactive mode.
Step 1:
First, we need a transistor model file. In this example, we will use the predictive transistor models (PTM) from the Nanoscale Integration and Modeling (NIMO) Group at Arizona State University.
Specifically, we will use the Low Power 45nm Metal Gate / High-K / Strained-Si transistor models, with a nominal supply voltage of 1.1V. The SPICE model file used has been updated to reflect the correct BSIM version (version 4.5).
Step 2:
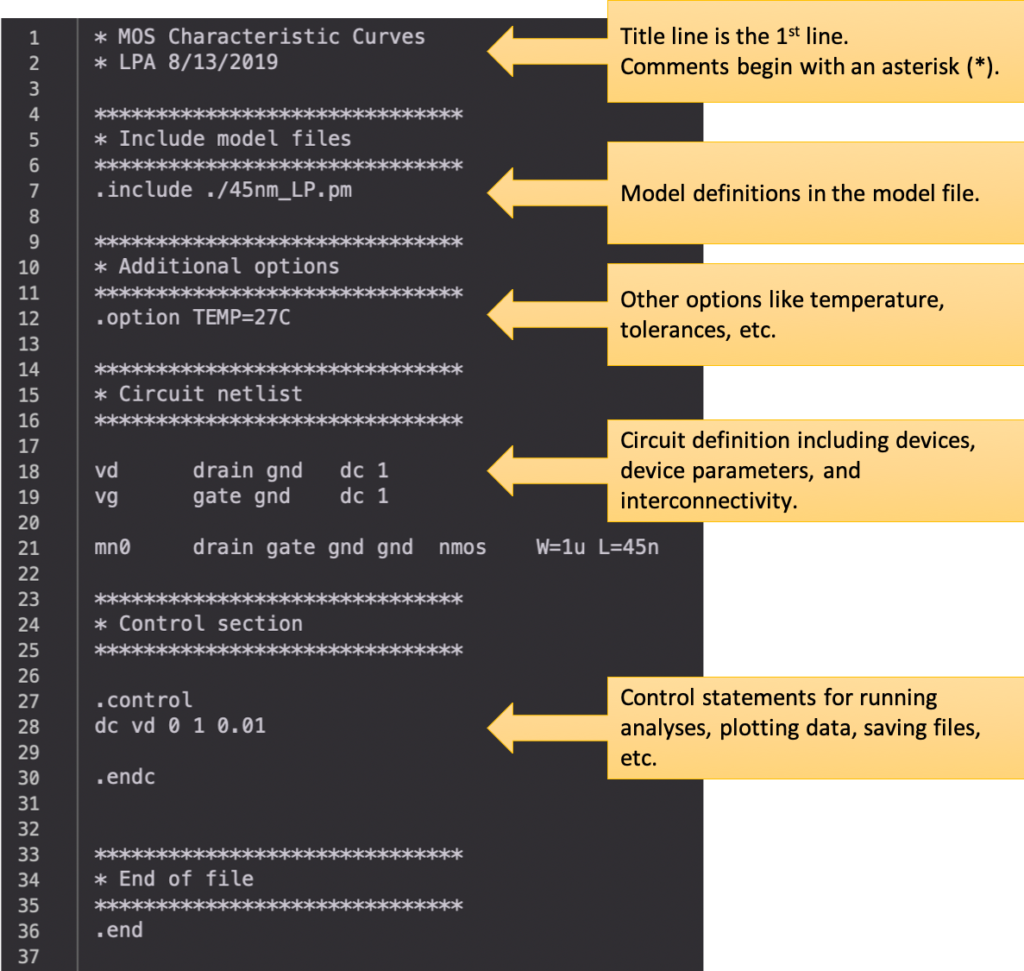
To specify a circuit, we need to create a netlist. The netlist describes the devices, their parameters, and how they are interconnected. In this example, we will use this netlist:
Voltage source instantiation:
vx..x <positive terminal> <negative terminal> <parameters>MOSFET instantiation:
mx..x <drain> <gate> <source> <body> <model name> <parameters>Step 3:
The ngspice simulator can be invoked from the terminal command line via:
$ ngspiceThis brings up the simulator in interactive mode, and you are presented with a prompt:
******
** ngspice-30 : Circuit level simulation program
** The U. C. Berkeley CAD Group
** Copyright 1985-1994, Regents of the University of California.
** Please get your ngspice manual from http://ngspice.sourceforge.net/docs.html
** Please file your bug-reports at http://ngspice.sourceforge.net/bugrep.html
******
ngspice 1 ->
Step 4:
To load our circuit netlist named mos_characteristics.sp, we type in the command at the ngspice prompt:
ngspice 1 -> source mos_characteristics.sp

Circuit: * mos characteristic curves

Doing analysis at TEMP = 27.000000 and TNOM = 27.000000


No. of Data Rows : 101
ngspice 2 ->
Note that the simulator has performed the analysis we have specified in the control section of the input netlist: a DC analysis, sweeping the voltage source vd from 0V to 1V, in steps of 0.01V.
Step 5:
We can view the output graphically via the command:
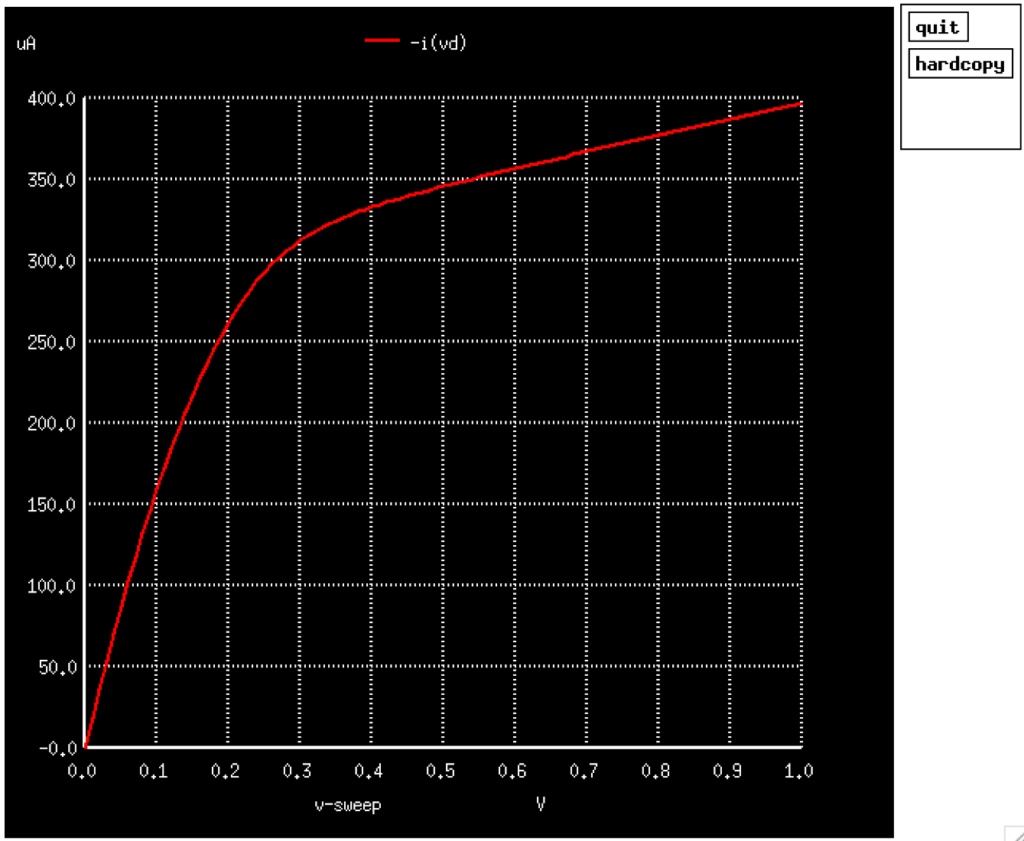
ngspice 2 -> plot -i(vd)The term -i(vd) specifies that we want to plot the current flowing out of the positive terminal of the voltage source vd. A negative sign is added since, by convention, the positive current is defined as the current into the positive terminal of the voltage source.
A window, showing the value of the transistor drain current (negative of the current into the positive terminal of vd) as the drain voltage is varied, is opened:
Step 6:
One advantage of running ngspice in interactive mode is it allows us to run simulations via the ngspice prompt without reloading the circuit. For example, if we want to plot the transfer characteristics instead of the output characteristics, we can just run the command:
ngspice 3 -> dc vg 0 1 0.01
Doing analysis at TEMP = 27.000000 and TNOM = 27.000000


No. of Data Rows : 101
ngspice 4 ->
This sweeps the gate voltage source, vg, from 0V to 1V, in steps of 0.1V. Plotting the drain current:
ngspice 4 -> plot -i(vd)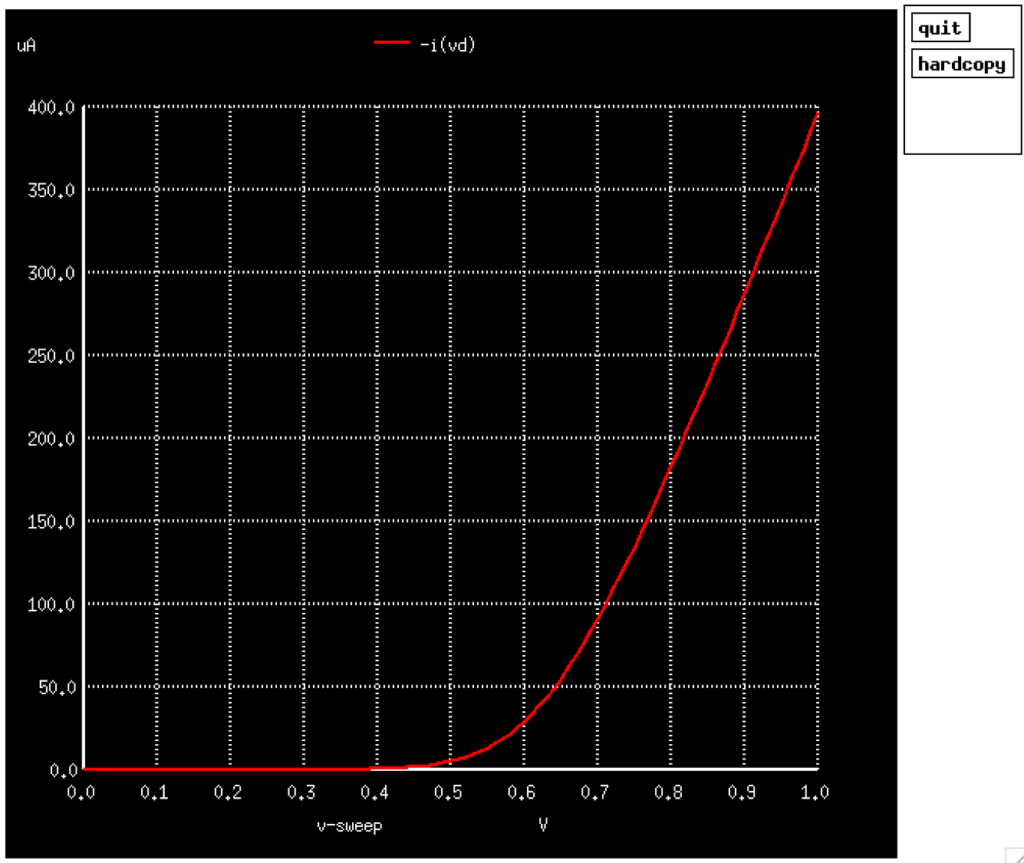
If we want to examine the details of the subthreshold region, we can plot the y-axis on a log scale:
ngspice 5 -> plot -i(vd) ylog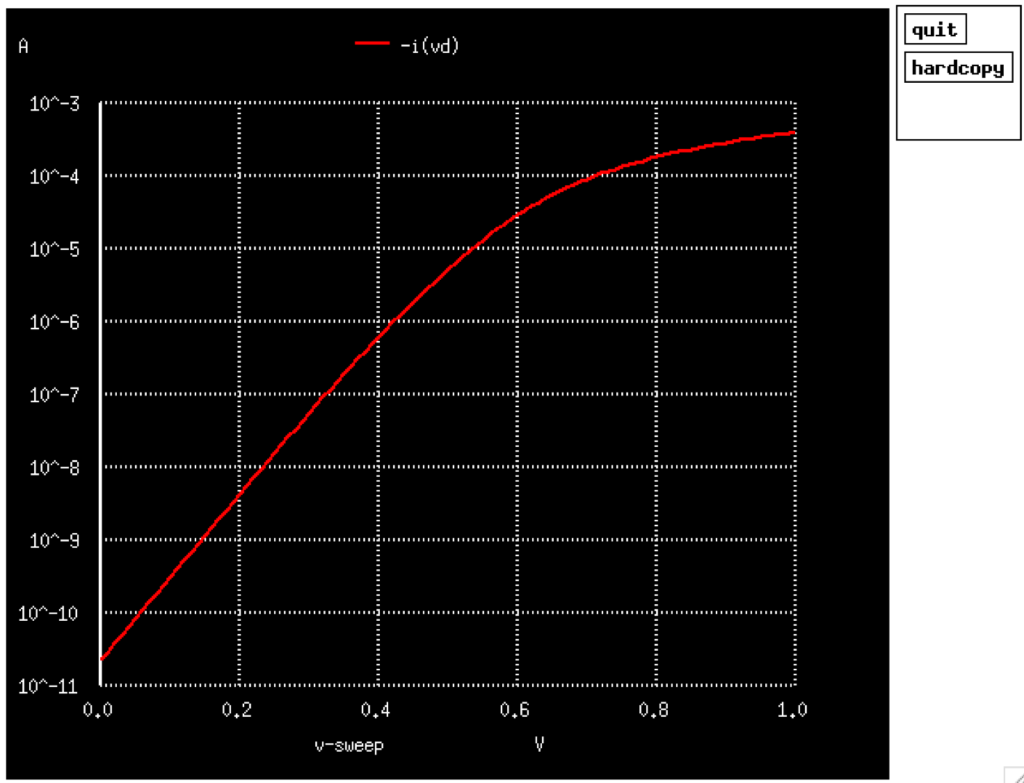
If we want to print the simulation result as a table of values and write it to a file mos_characteristics.dc, either for further post-processing or for other types of visualizations, we can use:
ngspice 6 -> print -i(vd) > mos_characteristics.dcOr alternatively, if you want to tabulate the results without the table headers, you can use:
ngspice 7 -> wrdata mos_characteristics.dc -i(vd)Printing Parameters
Transistor parameters such as small-signal parameters (taken at the calculated DC operating point) and model parameters can be read using the following commands:
ngspice 2 -> print @mn0[vth]
@mn0[vth] = 5.606939e-01
ngspice 3 -> print @mn0[gm]
@mn0[gm] = 1.103692e-03ngspice 4 -> print @mn0[id]
@mn0[id] = 3.970350e-04ngspice 5 -> print @mn0[gds]
@mn0[gds] = 9.859442e-05ngspice 7 -> print @mn0[cgg]
@mn0[cgg] = 7.760971e-16A complete list of accessible BSIM4 parameters are listed on page 608 of the ngspice user manual. Calculations can also be done on the parameters:
ngspice 8 -> let gm = @mn0[gm]
ngspice 9 -> let ro = 1 / @mn0[gds]
ngspice 10 -> let a0 = -gm * ro
ngspice 11 -> print a0
a0 = -1.11943e+01
ngspice 12 ->
Parameter Sweeps
You can also simulate the effect of varying device parameters by using more complex control constructs like loops:
* MOS Characteristic Curves
* LPA 8/13/2019

******************************
* Include model files
******************************
.include ./45nm_LP.pm

******************************
* Additional options
******************************
.option TEMP=27C

******************************
* Circuit netlist
******************************

vd		drain gnd	dc 1
vg		gate gnd 	dc 1

mn0		drain gate gnd gnd 	nmos	W=1u L=45n

******************************
* Control section
******************************

.control

* sweep transistor width and print dc operating point (op) drain current
let w_start = 1u
let w_stop = 5u
let delta_w = 1u

* initialize loop variable
let w_test = w_start

* loop
while w_test le w_stop
	alter @mn0[w] = w_test
	op
	print w_test @mn0[id]
	let w_test = w_test + delta_w
end
* end loop

.endc

******************************
* End of file
******************************
.end
Sourcing this netlist from the ngspice prompt results in:
******
** ngspice-30 : Circuit level simulation program
** The U. C. Berkeley CAD Group
** Copyright 1985-1994, Regents of the University of California.
** Please get your ngspice manual from http://ngspice.sourceforge.net/docs.html
** Please file your bug-reports at http://ngspice.sourceforge.net/bugrep.html
******
ngspice 1 -> source mos_characteristics.sp

Circuit: * mos characteristic curves

Doing analysis at TEMP = 27.000000 and TNOM = 27.000000


No. of Data Rows : 1
const.w_test = 1.000000e-06
op1.@mn0[id] = 3.970350e-04
Doing analysis at TEMP = 27.000000 and TNOM = 27.000000


No. of Data Rows : 1
const.w_test = 2.000000e-06
op2.@mn0[id] = 7.971365e-04
Doing analysis at TEMP = 27.000000 and TNOM = 27.000000


No. of Data Rows : 1
const.w_test = 3.000000e-06
op3.@mn0[id] = 1.197236e-03
Doing analysis at TEMP = 27.000000 and TNOM = 27.000000


No. of Data Rows : 1
const.w_test = 4.000000e-06
op4.@mn0[id] = 1.597335e-03
Doing analysis at TEMP = 27.000000 and TNOM = 27.000000


No. of Data Rows : 1
const.w_test = 5.000000e-06
op5.@mn0[id] = 1.997433e-03
ngspice 2 ->
Using Python
We can use python programming for better graphs, and/or further data analysis and processing, in conjunction with the ngspice batch processing mode.